Volume Profile Levels
The volume profile helps us identify where significant positions might have been accumulated, potentially by major market participants. Since these large players typically aim to avoid losses, it is reasonable to assume that these high-volume areas (potential positions of large players) are likely to be defended.
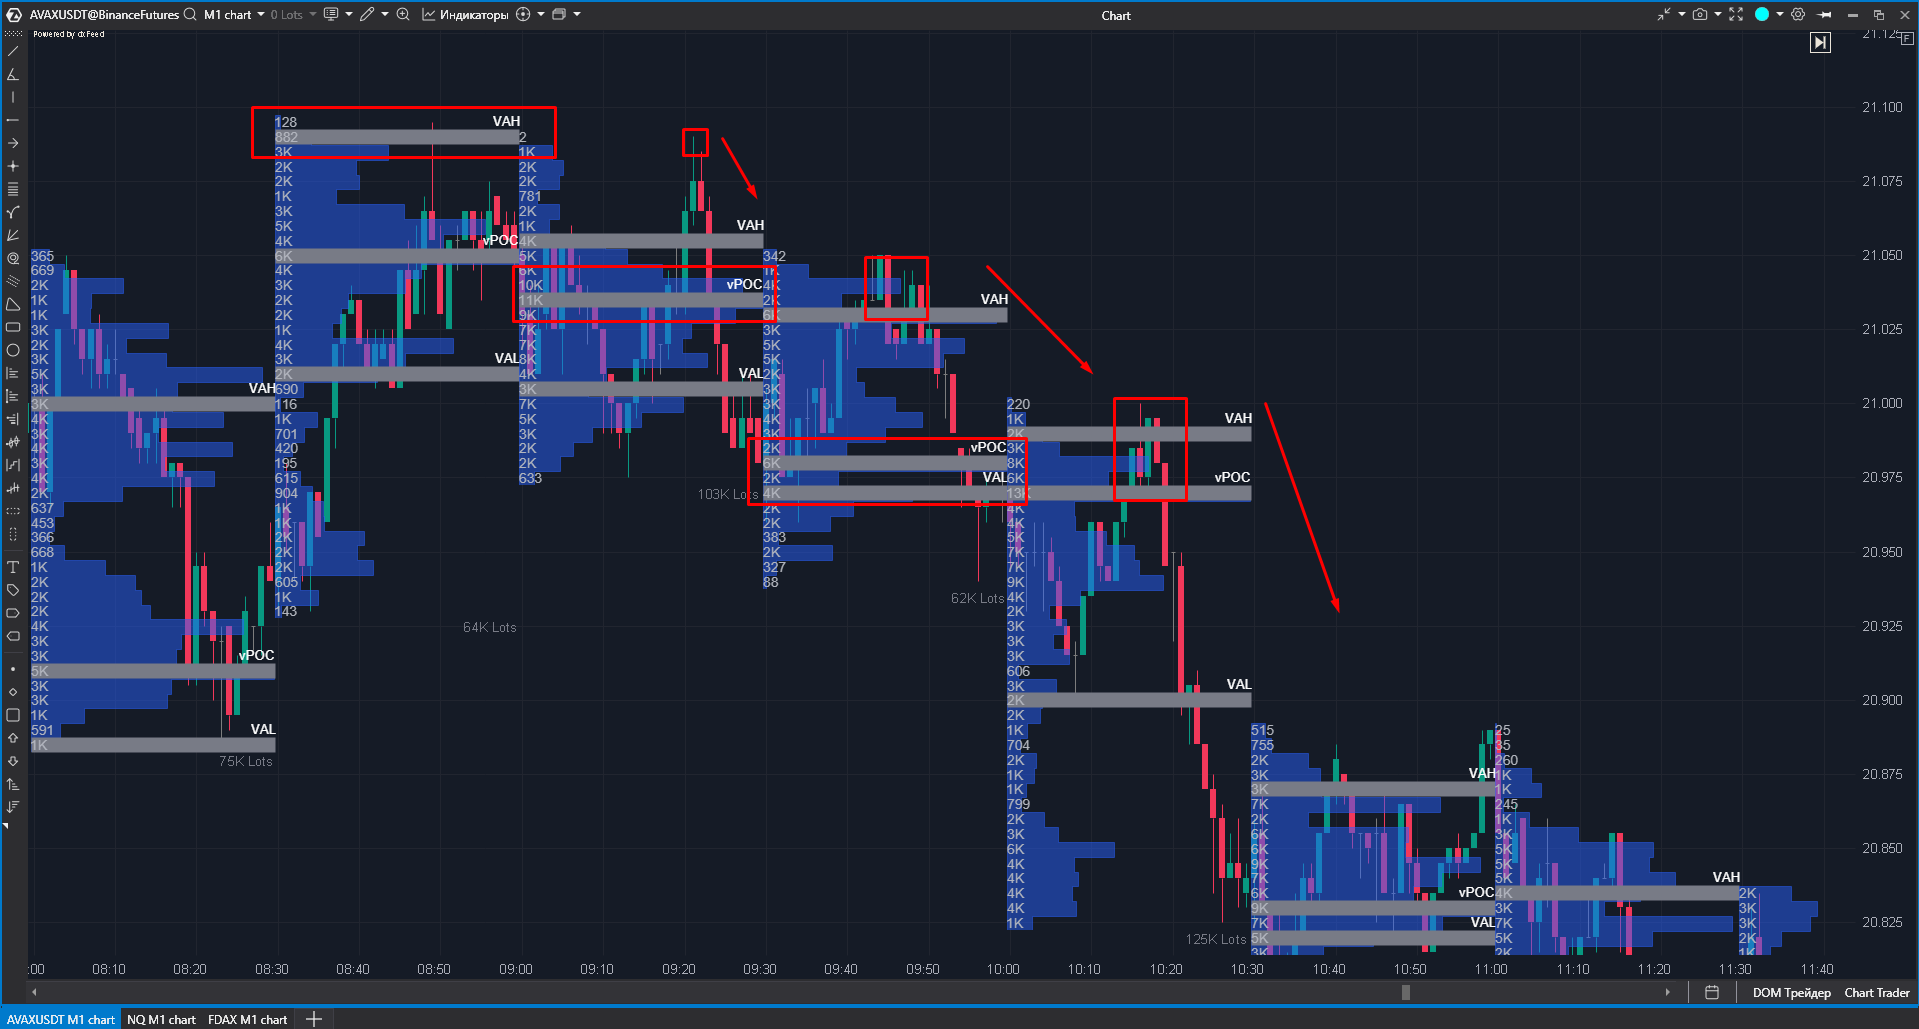
The ATAS platform offers various ways to visualize the volume profile. We will focus on using the Market Profile & TPO indicator, which displays the volume profile for the selected period (in this example, we are looking at AVAXUSDT on a 1-minute chart with a volume profile period of 30 minutes).

After adding this indicator to your chart, you can customize it as needed, but we will illustrate the standard display.
By default, this indicator shows:
horizontal volume visualization for each price level (indicated by blue lines);
the POC level with the highest trading volume for the selected period (in this example, 30 minutes);
Volume Area Low/High (VAL/VAH) levels which are the upper and lower boundaries of the area where 70% of the volume was traded during the selected period.
Examining the chart history with this indicator, you will notice how the price frequently reacts to these levels, at least in the short term.

If you take a close look at the chart history, you will see that the price might not always react to a level right away; it might only respond on the second or subsequent attempts. That is why it is important to use specific triggers to help determine when the price is likely to bounce off a level. To achieve this, we will use cluster patterns, examples of which we will explore further.
Last updated